Google Analytics has been for few years now the go-to marketing tool, not only at the metrics extraction level but also to understand the behaviour of website users.
But Google Analytics is still a huge monster where obtaining specific data is sometimes almost mission impossible, particularly when we are starting to work with this platform.
Last week we already put together a few tips to make using this tool easier. Today we will give you another 5 recommendations that will surely help you to get the most out of Google Analytics.

6 Increase the conversion rate with the bounce rate metric
The bounce rate is an important metric because it reflects users’ commitment to a website.
Oddly, the bounce rate is typically poorly understood and misunderstood by many a webmaster, blogger and SEO manager.
The bounce rate is essentially the percentage of unique pageviews or web sessions. In other words, the bounce rate represents the percentage of visitors to a website that arrived at a particular page and left after viewing just that page (eg the ‘Services’ page).
The bounce rate is the metric that reveals how truly useful a website’s content is.
The lower the bounce rate, the better in most cases. This means that a bounce rate of 34% is, of course, a lot better than 87%. Since a lower percentage is an indication that the content is more useful, users were more satisfied and stayed around longer.
NOTE: Nevertheless, it is not useful to use only this metric as a reference and say that 34% is better than 87% if we do not put it into context and evaluate the goals that we have set, such as eg interactions, time, acquisition channel…
In the end, our goal must be to monitor the bounce rate to try to bring it down. If you want to decrease the bounce rate of your landing pages, you can do it by following the path below:
Behaviour > Site Content > Landing Pages
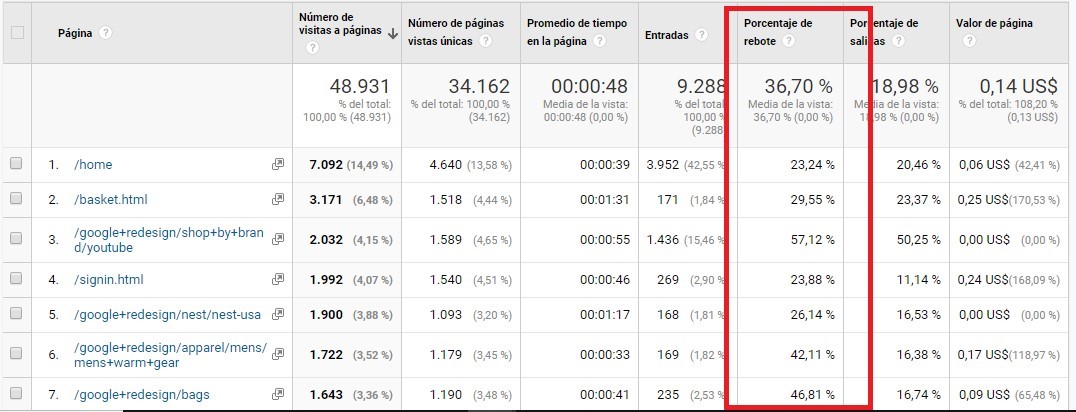
Every small improvement in the bounce rate will probably lead to a higher conversion rate.
Let us see an example
A marketing and CRM automation website noticed that its bounce rate had jumped by 42% in a three-month period.
The company took the right steps to fix this. It changed the text format, improved the internal linkage and added a video to the homepage. As a result, the website recorded a 15% increase in form sending.
If in Google Analytics you see a very high bounce rate in some of your highest performing pages with regard to others, ask yourself what the reason could be. Audit the affected pages and optimize them to increase conversions.
7 Use site search queries
There are many websites which are too complicated to use. The important information or content is hidden and, in many cases, the pages crash when they are viewed via mobile devices. This scenario bothers users.
However, a clue that the visitors who arrive at a website are its target is their use of the internal search engine.
Do you know which search terms they enter?
Google Analytics makes it rather easy to find out which these terms are. To obtain this information, you will have to set up a special report.
Click on “View Settings”, set “Site search Tracking” to on (as shown in the screenshot below) and add the query parameter:
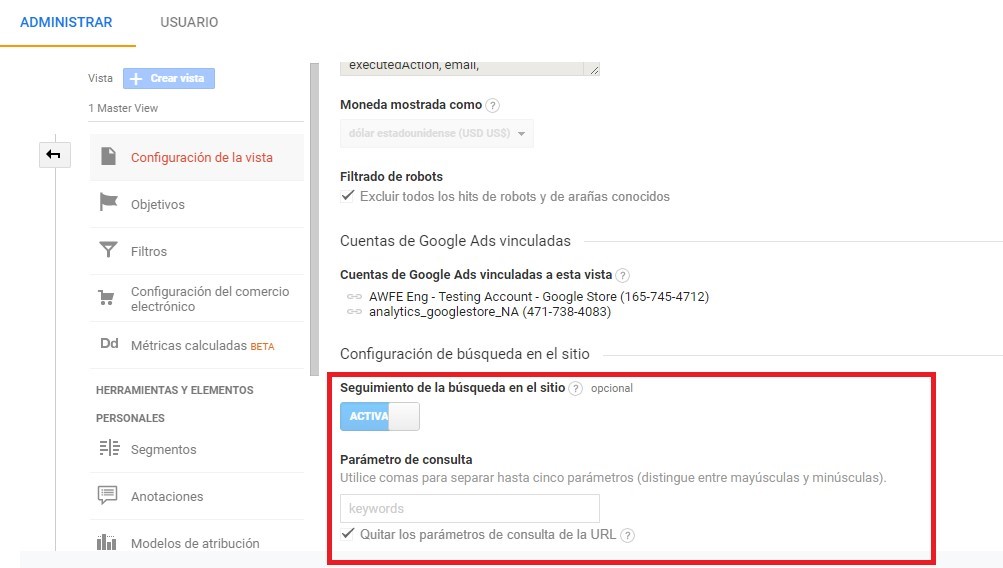
NOTE: To add query parameter/s, in most cases it is enough to add what comes after the ? character in the path.
Example:
Pay attention to this q parameter: this is the value you will have to enter.
WordPress has q by default (it is set up by query); other CMSs in the market will have similar ones. Here are some of these parameters: query, search, searchword, searchquery, query, s, q, qs, string, searchq...
Perhaps, the easiest thing would for you to make a search and see how the path changes after it. In some cases, the value will be displayed, and in others, nothing will be returned (dynamic pages).
By analyzing this report you will be able to see the exact keywords people entered in your internal search box, directly on your website.
This is how you can find this important report:
Behaviour > Site Search > Search Terms
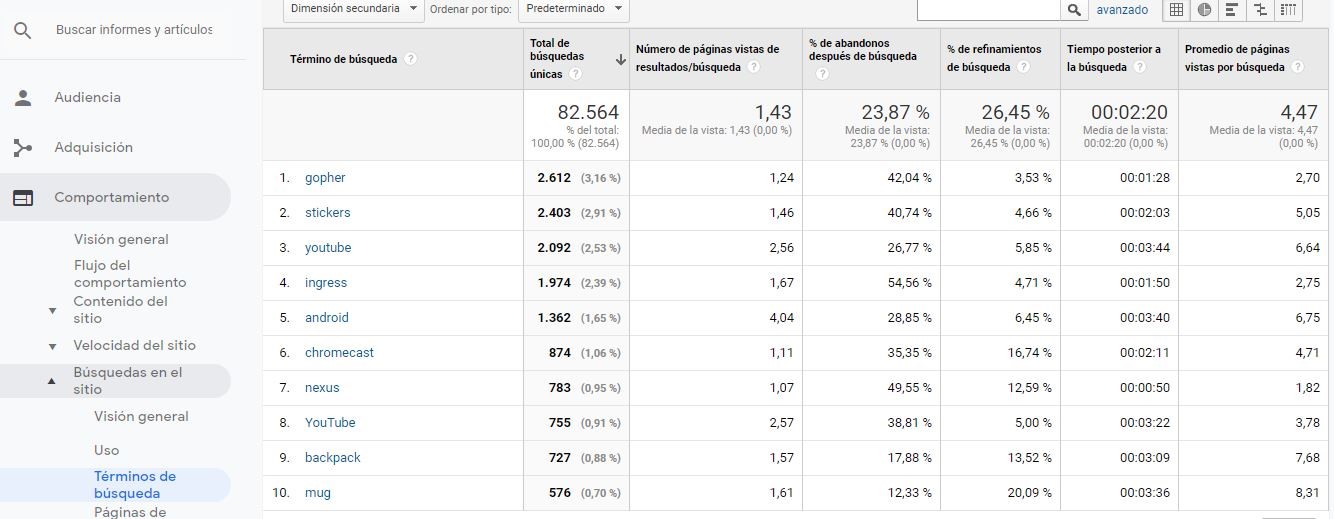
Once you have filled in the report with these site search terms, there are several ways in which you can increase your conversions. You can recommend products and services related to the keywords.
You can even use the information you collect from your email campaigns. Or even better yet! Find out what is the most frequently entered keyword and create specific high-value landing pages to serve this segment of visitors to the website.
8 Use regular expressions in filters and reports
If you automate some of the tasks you will get more out of Google Analytics and better results from it. However, even if most of these tips have dealt with the use of the interface, this one is a bit different and can be used in many different places inside Google Analytics (and Google’s Tag Manager).
What are regular expressions?
Regular expressions (RegEx) are a way of setting oneself apart from casual users of Google Analytics.
A short definition: They are a way of describing patterns in text by using special characters. Let us see what they are in a bit more detail.
Say you are seeing your “All Pages” report inside Google Analytics and you want to define some specific pages. Maybe the Home, Services and About Us pages.
You can extract the entire report, move up and down to find the pages you need, and write down their numbers. Or you can load the report, search for Home, make a new Services search and then make a new About Us search.
In fact, there is a very easy way of doing this: making a search in the report itself. In all Google Analytics reports, the table’s filter box accepts regular expressions in a predetermined manner, which means that you can only write in that search box a sentence that represents the following:
Home Or Services Or About Us
Something like this would be displayed: ^ (/ | / services / | / about-us /) $
The easiest regular expression to learn is the pipe (|), which just means OR. There are other characters that indicate optional characters, “starts with” and “ends with”… and many more!
If you would like to learn more about regular expressions, here are some guides:
9 Follow the path of the generation of leads before they convert
People are obsessed with generating leads. Many forget that feeding existing leads is the best way of growing a business. You probably have a sales representative or a department that is in charge of nurturing your leads – but do you delegate responsibility to them?
First of all, we must rate our leads and understand their trajectory inside our website. According to HubSpot statistics, “only 25% of leads are legitimate and must be referred to a sales representative.”
Leads usually go through three basic stages before trusting, believing and liking. This is how online marketing works. The three-step process involves:
- Awareness
- Consideration
- Decision
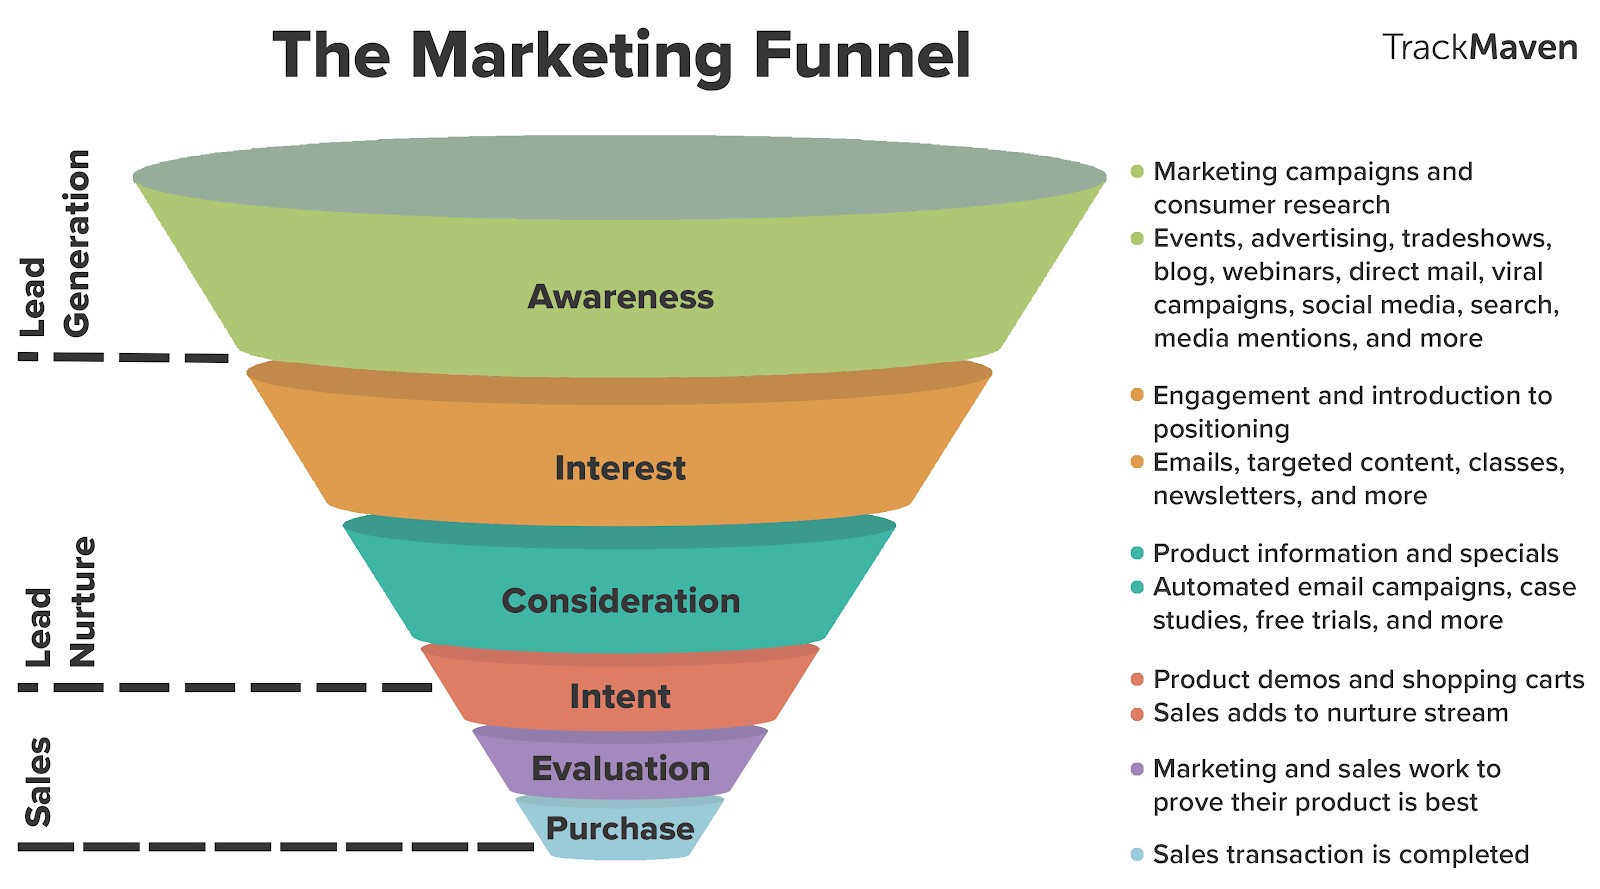
In order to understand the different points of contact users go through before buying and the pages they access on your website, you can see their behaviour flow in Google Analytics by following this path:
Behaviour > Behaviour Flow
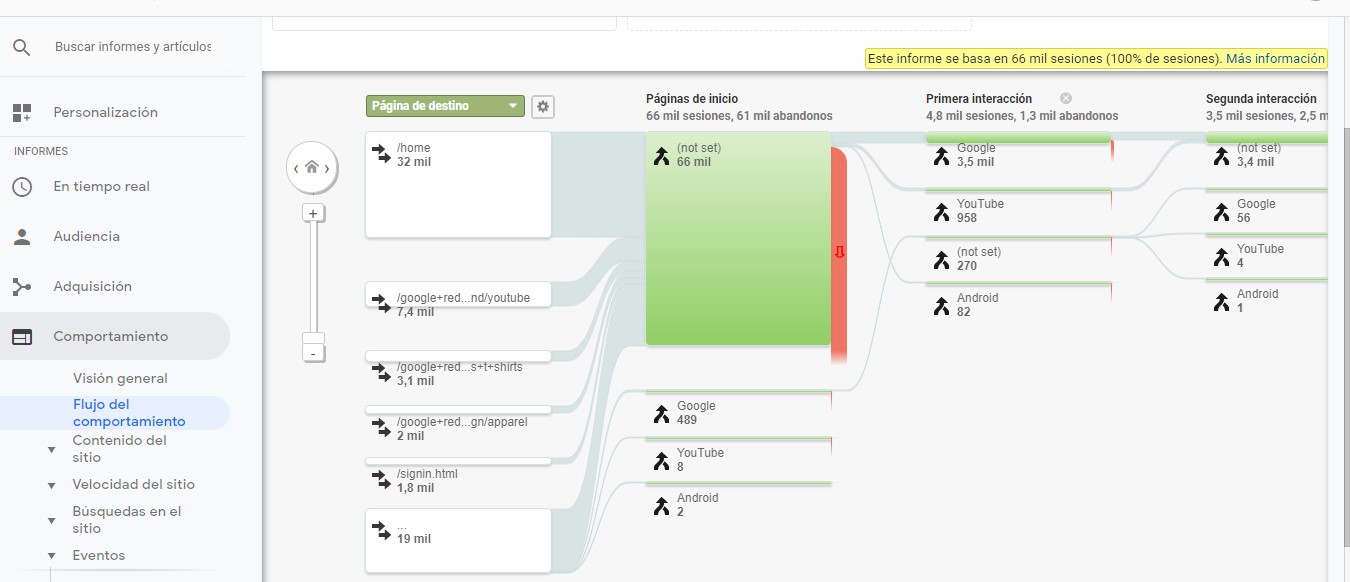
In order to obtain impartial results, focus on new users of your website who do not have past experience with your brand. Hence, sort them by new user or new visit. Then you will be able to see how new users interact with your pages, where they started from, how they left, and so on.
NOTE: If would also be useful to go a little bit deeper, perhaps with segments by device or acquisition channel.
Knowing the common sequences from the page history and how new users get involved, browse and use your web pages will help you to design a better user experience on your site.
10 Analyze the page commitment between mobile and desktop views
Even though, according to comScore, the use of mobile devices has surpassed desktop traffic, desktop users must not be ignored. Because not everybody likes using mobile devices. And certain tasks are easier to do on a larger desktop screen than on a smaller display.
As a business owner, digital marketer or website owner, do not spend all of your time and resources optimizing website conversions for mobile device users only; also do it for desktop users.
Obviously, mobile devices can generate most of your website’s traffic, which is good. Here you can find and analyze the results between mobile and desktop channels:
Audience > Mobile Devices > Overview
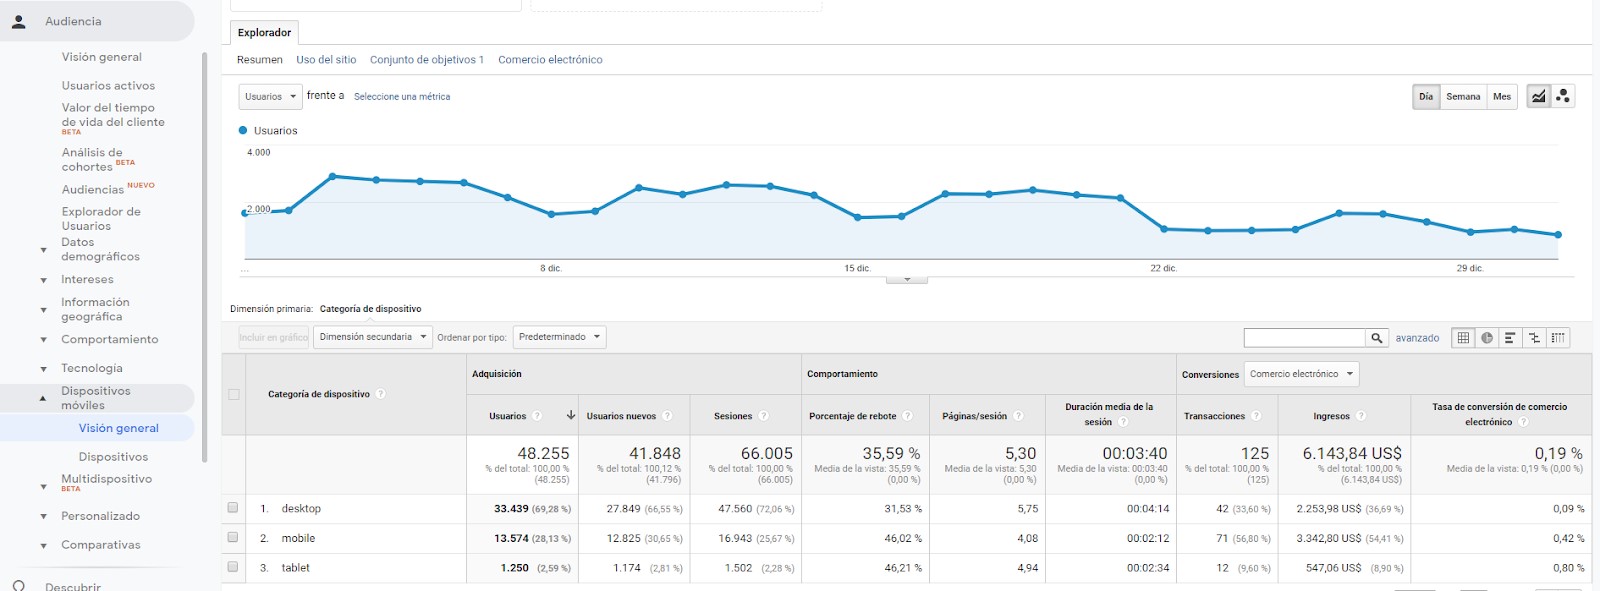
As soon as you enter the report, break down the tabulated data by selecting your main conversion/sales goal.
If we look at the screenshot above in terms of revenue, we can see that mobiles (37%) and tablets (9%) generated fewer conversions than desktops (54%).
In terms of conversion rates, we are taking about 0.80% for tablets, 0.42% for desktops and just 0.09% for mobile devices. It would seem that mobiles generate a lot more sessions for having a lower rate.
Professional advice: If a mobile segment does not generate enough traffic or sales, there is a tendency to assume that users do not find it easy to browse the site using their mobile device. Make sure to study the differences in traffic, behaviour and conversions (sales).
Conclusion
Google Analytics is a safe bet to get insights and find opportunities that might also improve a website’s organic position in Google.
However, optimizing the search engine is not a digital marketing strategy that is devised and then forgotten. It must be tackled according to a data-driven, holistic approach whilst using a website’s attractive content to gain traction, attract qualified leads, improve its positioning, and increase sales.
Once you understand what drives people to use your website, you will find it easier to talk their language and make them participate thanks to well-thought-out content.
Comments are moderated and will only be visible if they add to the discussion in a constructive way. If you disagree with a point, please, be polite.


Tell us what you think.