Undoubtedly Machine Learning is one of the fashionable terms nowadays in the world of technology.
The algorithms of Machine Learning try to learn from the data, and the more data available to learn and the richer and fuller the algorithm, the better it works.
In this post, we will delve into the operation of some of the most used algorithms.
Ideally, the training data (In) would be labelled (0n). For example, imagine that we want to have an algorithm that detects if a tumour is benign or malignant based on certain of its characteristics.
Some of these characteristics could be tumour size, density, colour or other clinical data. Suppose we have a history with the characteristics of multiple tumours that we have studied in the past, this would be (In), and we already know if each one of these tumours was malignant or benign, (0n).
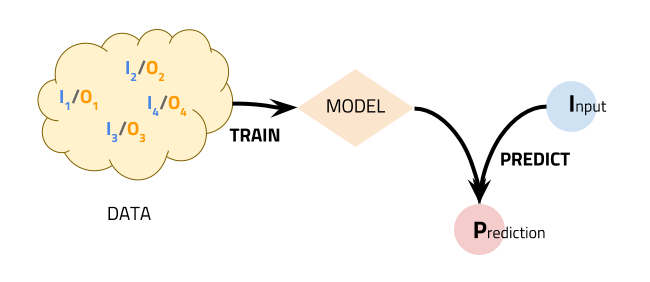
First, what we would do is provide our algorithm with all this data to "train" it and learn from patterns, relationships and past circumstances. In this way, we will get a trained model.
Once we have this trained model, we can ask him to make a prediction by giving the characteristics of a new tumour (I), which we do not know if it is benign or malignant. The model will be able to give us a prediction (P) based on the knowledge it extracted from training data.
What defines a "good" or "bad" algorithm is the precision with which it makes the predictions in a given domain and context, and based on available training data.
Precisely the main task of data scientists is to "tune" and adjust the algorithms to suit each problem and, on the other hand, to clean and prepare the data so that the algorithm can learn as much as possible from them.
Next, we will discuss the characteristics of some of the most widespread algorithms and how they are able to learn from the data.
Linear regression
Linear regression is one of the most widespread and easy to understand classical algorithms. The aim is to model the relationship between a dependent variable “y” and one or more independent variables “x”.
Intuitively, we can imagine that it is about finding the red line that best "fits" with the set of given blue dots. To do this, we can use methods like "least squares" that seek to minimise the vertical distance of all blue points to the red line.
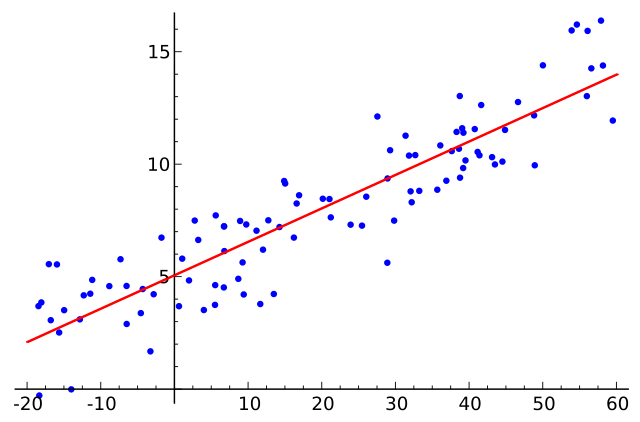
Once this "red line" is obtained, we will be able to make hypothetical predictions about what would be the value of “y” given “x”. It is likely that we always make certain mistakes in prediction.
Linear regression is a guided method, in the sense that we need an initial set sufficiently representative of "blue dots" to "learn" from them and to make good predictions.
Some interesting applications of linear regression are the study of the evolution of prices or markets.
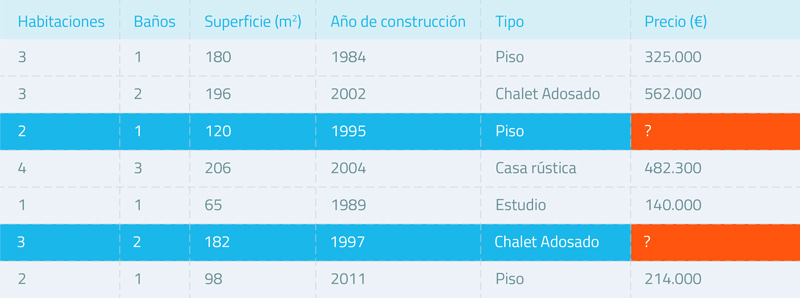
A classic example is the prediction of the price of housing where the variables “x” would be the characteristics of a house: size, the number of rooms, height, materials... and the “y” would be the price of that dwelling.
If we could analyse the characteristics and the price of a sufficient set of houses, we could predict what would be the price of a new dwelling based on its characteristics.
Logistic regression
Logistic regression has certain similarities in its approach to linear regression, but it is oriented to solve problems of classification and not of prediction.

The idea is to be able to assign one category or another given some input characteristics. For this, it relies on a logistic function such as the “sigmoide” function, which takes as input any real number and returns a real number between 0 and 1 that we can read as a probability.
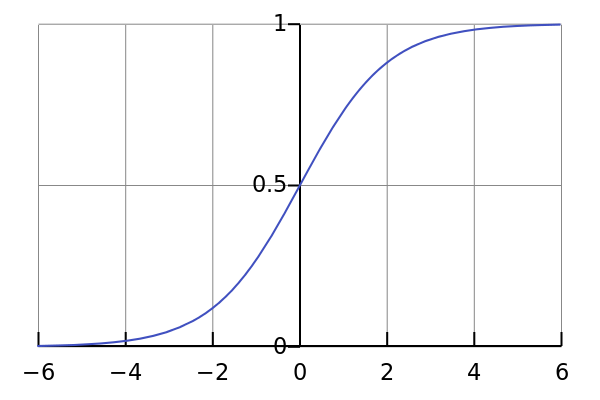
To apply logistic regression we will also need a set of data previously classified to train our algorithm. Logistic regression has multiple applications, such as risk assessment, tumour classification or SPAM detection.
Clustering K-means
K-means is an iterative non-guided algorithm, capable of finding clusters or relations between the data that we have without having to train it previously.
The idea behind this algorithm is relatively simple:
- In the first place, we will indicate how many clusters we want to identify and initialize, through some random mechanism, a point or centroid for each cluster in our data space.
- For each input data, we will see which is the closest centroid in distance and we will assign it to that cluster.
- We will take all the points assigned to each cluster and calculate what would be its midpoint in space.
- We will move the corresponding centroids to the midpoints calculated in the previous step for each cluster.
- Repeat iteratively from step 2 until converging.
In this way, we will assign each point in the input space or entry value to a cluster and we will have achieved our goal.
Its use is very widespread and is used in many fields, for example in search engines to see the similarities that exist between some elements and others. However, this algorithm is computationally complex and may require a lot of computing power.
SVM
SVM stands for Support Vector Machine. This supervised algorithm is generally used to solve classification problems.
The idea of the algorithm is to be able to find, with the training data, a hyperplane that maximises the distance to the different classes, which is known as the "maximum margin".
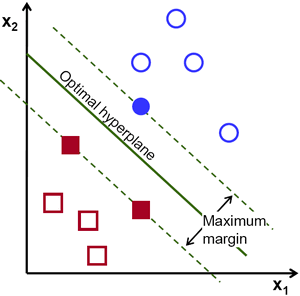
Once this hyperplane is found, we can use it to classify new points.
SVM has multiple applications, for example for image recognition, text classification or applications in the area of biotechnology.
Random forest
Random Forest is one of the most powerful and used algorithms nowadays. It consists of a combination of multiple decision trees that together form a "forest".
A decision tree is a metaphor of a real tree, since, graphically, the parts of a decision tree have some resemblance to the branches of a tree.
Given an input value, we will classify it by saying that it goes to one branch or another based on a condition.
Decision trees can be more or less deep and complex, and the difficulty is to define them correctly so that we can correctly classify our problem data.
Random Forest makes use of a set of decision trees and each is assigned a portion of the sample data or training. The end result will be the combination of the criteria of all the trees that form the forest.
This approach is ideal for splitting and parallelizing the work of computing, which allows us to be able to execute it very quickly using several processors.
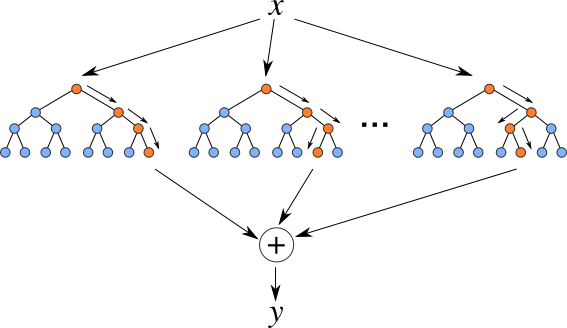
This algorithm has many applications, for example in the automotive world for the prediction of breakages of mechanical parts, or in the world of health for the classification of diseases of patients. This algorithm is also used in voice, image and text recognition tools.
Conclusion
These are some of the best-known algorithms, but there are many more. On the other hand, the configuration options and adjustments that we can make in each algorithm are very large, this has given rise to new profiles specialised in advanced data analytics and Machine Learning.
To sum up, we can say that Machine Learning is a huge field within Artificial Intelligence and, undoubtedly, the one that is having most results and applications nowadays.
Accessing this knowledge is easier than ever, and the technological possibilities allow us to have a great capacity of computation and storage of data. This allows us to apply these algorithms much easier in any business or industry, from startups to large companies.
Comments are moderated and will only be visible if they add to the discussion in a constructive way. If you disagree with a point, please, be polite.


Tell us what you think.