I am increasingly more inclined to think that most companies do not oversee the progress of their digital business. And I am not just talking about small companies but also big ones.
One of the problems I have run into when doing consultancy work on digital analytics is that people think that it is a subject matter pertaining to technicians or marketing people only.
The digital activity, from marketing to the end results of a conversion, is too important an element NOT to be monitored and controlled.
If you have made an investment, wouldn’t you check to see whether it is making money or not? I am assuming the answer is yes.
We must do the same with our digital projects – for two obvious reasons: because they are an integral part of our business and because, irrespective of the size of the investment, their effectiveness has to be checked to see whether it is worth it to keep putting money into them or whether it would be better to shift the budget to other channels.

Why measure?
Have you ever played any sport or had a hobby and you tried to get better at it?
Just like in our personal life, we would also like our business to ‘improve’, we want to be more efficient: to bring the number of clients up, put new products or services to the market or cut down lead times and overall costs.
These are things that can only be improved if they are measured.
Are you not an expert on Google Analytics?
These are some of the excuses I get to hear more frequently: “I don’t have the time”, “I don’t have the knowledge”, “Google Analytics’ interface is always changing” and so on and so forth.
Yes, it is true that Google Analytics is a tool that requires some knowledge, but there are solutions out there that can help us to simplify all the data that is generated by the digital business and make it easy to understand. I’m talking about dashboards!
What is a dashboard?
A dashboard is a screen that allows the progress of the most important commercial metrics and reports in our enterprise to be monitored in real time.
They allow the different departments to stay abreast of the most important data at all times. And this not only affects the marketing and sales team but also the administration, finance, IT, logistics and other departments.
Of course, every company should have its own personalized dashboard to:
- Measure its performance, particularly in terms of marketing and sales.
- Make decisions quickly and follow suit.
- Make the data accessible at a single glance.
- Align the goals of the different teams.
How is a dashboard created?
I know, I know, the ideal thing would be to have a magical tool that would automatically create a great dashboard that would solve all our problems. Unfortunately, a big mistake people make when they start using the tool is to have it begin to randomly add indicators, charts and tables right away. It is useless! The secret behind setting up a dashboard properly is to first come up with a measurement plan.
The measurement plan
In short, a measurement plan is a document that translates your main business goals into metrics that can be measured on your website.
Not only will it provide a framework for tailoring your web analysis but will also be a crucial part of a wider digital marketing strategy. This will then determine how your digital channels should be better adapted in order for the goals of your KPIs to be achieved.
Not having a measurement plan is like groping your way in the dark in your business. Without it, we will not be able to know:
- Our business goals and strategy.
- The performance and commitments of the strategies (KPIs).
- The measurement metrics.
Hence, the right way to introduce dashboards is first to come up with a measurement plan, then to implement it in both the web and Google Analytics and finally to extract/link information using dashboard creation tools.
According to Google’s evangelist Avinash Kaushik, a measurement plan has 5 aspects to it:
- Goals
- Strategies and tactics
- KPIs
- Segments
- Target
1 Goals
We must always start with the goals, which must be – according to Avinash’s original guidelines – DUMP, in other words:
- Doable,
- Understandable,
- Manageable, and
Below there are some good examples of this:
- Increasing sales.
- Increasing brand awareness.
- Attracting qualified leads.
- Maximizing the loyalty ratio and the social engagement or socially improving the impact.
2 Strategies and tactics
Once we have set the goals to be reached, we will have to define the strategies for doing so by means of some tactics, which will be successively monitored through actions.
Here is one example: if the goal is to achieve a 10% increase in online transactions in a quarter, a strategy could be to find a segment of potential customers in market niche X, and the tactic would be to use a marketing channel or a set of marketing channels (content marketing, banner advertising…).
3 KPIs
Here are the famous key performance indicators – with which our strategies and tactics can be measured.
It is worth noting there are different kinds of KPIs:
- Marketing KPI: ROAS (Return On-Ad Spend), the return for every €1 spent in advertising.
- Sales KPI: ROI (Return On Investment).
- Offline KPIs: financial/economic ratios; logistic or productivity indicators; sales indicators.
- Micro-conversion KPIs: the percentage of the details of product data sheets viewed that has actually been read; the ratio of actions regarding a post on a blog; the percentage of the total scrollable length (x%) that has been scrolled on a certain post.
- Final KPIs: the rate of conversion of marketing channel X; the CPL (cost per lead); the CPA (cost per acquisition).
4 Segments
We not only need to monitor what people are doing in our digital projects but we also need to know which segment they belong to and which subset or conditions match.
For example: age range; traffic source; geographical locations; mobile or desktop device; male or female audience…
Segments are most effective when they are developed during the KPI phase of the measurement plan, so it is advisable to establish the KPIs associated with the different segments.
5 Target
This is one of the hardest parts. A target is defined as a goal to be achieved that is temporarily hanging between the measurement of its performance until the moment we manage to raise the company’s performance levels. In sum, setting a target means quantifying the KPIs into numerical values.
To this end, the goals of our target must be well defined and feasible and, above all, delimited within a certain amount of time.
For example: “I want to increase turnover by 10% in 6 months,” is not the same as “I want to sell more than 100,000 units over this weekend”.
Putting the measurement plan into practice
Sadly, the technical part is often overlooked – because developers do not have time, because it is not considered important, because there is no one with these skills, because no budget has been allocated to it or, simply, because nobody knows what to do and how to do it.
It is important for the website to have been properly developed. This is why we need to check to see whether the different elements of the micro-conversion or conversion are traceable: buttons, calls-to-action, forms, thank you pages, downloads, videos, page scrolling to see whether an article has been ‘read’, and many personalized behavioural events for improving UX.
Therefore, we need an ‘analyst-developer’ to be in charge of our website, who can configure the monitoring and everything else in Google Analytics while at the same time using a tag administration manager such as Google Tag Manager, Tealium or the like.
Designing dashboards
Now that we have the measurement plan, let us create the dashboard. When building a dashboard is it advisable to follow the following steps:
1 Identify the type of business
Each company has its own characteristics and needs its own custom-built dashboard. This is why it is important to identify the type of business in question.
We need to ask questions like the following: what kind of project do we have? Does our company have a multilingual website? Does it allow e-trade or have a product catalogue? Does it have landing pages? Do we have a potential customer acquisition project in place? Does it use CRM? Is there a mobile app? Does it have a meetup announcing an online event or class?
2 Define the end users
It is very important to consider who must check the dashboards since every user will have specific duties and different skills.
Potential users:
- Stakeholders
- The data analyst
- The SEO or digital marketing roles
- Salespeople
- Social media people
- Finance people
- IT developers
A director or the stakeholders, as well as the CEO or the owners of an enterprise, need to get an overall view of the progress of their web or digital project without going into much technical detail, unlike the data analyst, for whom everything will be available, with information about the different areas.
The people involved in digital marketing need to have detailed information about the website’s traffic, the best performing keywords and the most effective content in search engines.
Here, it is advisable to have dashboards which are directly linked to the Google Search Console or use paid traffic acquisition tools such as e.g. Google Adwords.
Lastly, IT developers will also need to monitor faults, eventual bugs, controls, and even processes, to which end they will need a dedicated dashboard.
3 Types of instrumentation dashboard
Different kinds of dashboards can be created depending on the end users and the type of business:
- Overview
- Traffic and content
- Languages/overseas
- Conversions
- Adwords
- Social media
- ...
Laying out a dashboard
We still need to do a small thing before using the tools. My advice is to get a pencil and some paper and start drawing! Drawing a mock-up will help us to have everything organized in advance.
The first elements we need to consider, even if some might seem trivial, are the following:
- The name of the dashboard (e.g. summary visits).
- The company logo/brand (this is important, so don’t forget it!).
- The range of dates (selectable).
The dashboard creation tools
We have finally arrived at the tools. To begin with, let us differentiate between business intelligence dashboards and analytics dashboards; paid, free or freemium, etc.
Google Data Studio
Google Data Studio can be a good choice**:**
- It is a continually evolving tool. The beta version currently has many connectors for integrating it with other tools.
- It is perfectly integrated with the Google ecosystem.
- It has many premade templates.
- It is free of charge.
Data Studio basically allows doing two things:
- Linking data from sources like Google Analytics.
- Visually representing any piece of data.
At the beginning we need to configure segments, events and conversions for monitoring them in Google Analytics:
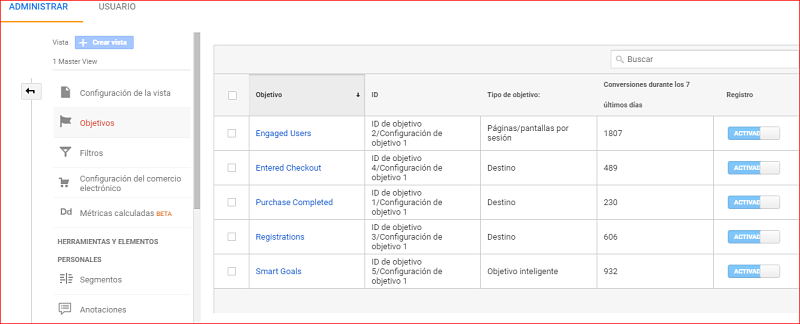
Next, we need to link the Data Studio data source to our Analytics account, and then select the appropriate graphic indicators linked to the metrics we would like to monitor.
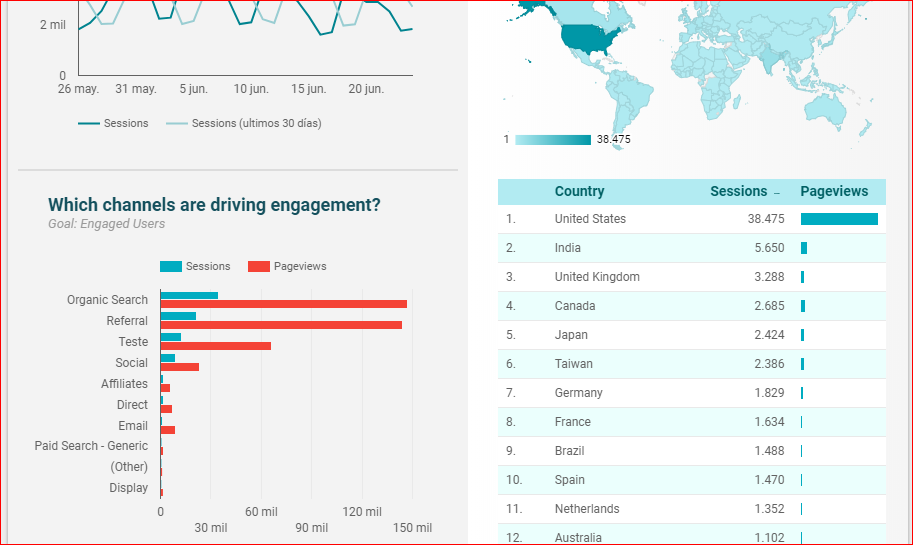
Let us see the dashboards of a page of destination advertising an e-book about some scientific research:
Traffic dashboard
Conversion dashboard
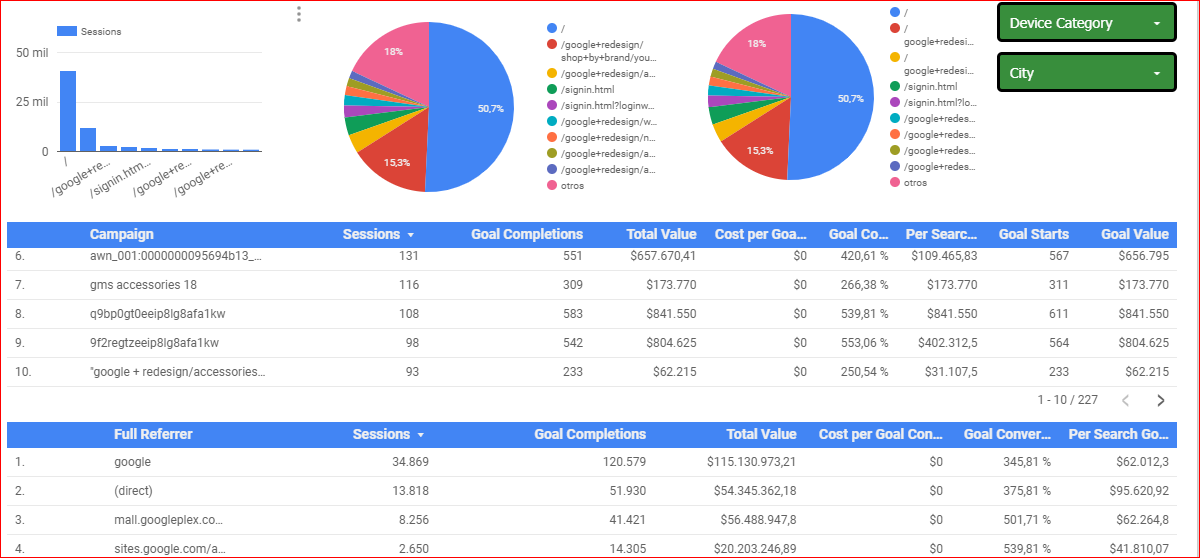
In addition, it allows us to get creative because we can use background images and graphic elements to make our dashboards more striking and make sure the end users can control their ‘affairs’ in a more skilful manner.
Free resources for Google Data Studio:
- Data Studio Report Gallery.
- Free Google Analytics (Lead Generation) Data Studio.
- Template for Adwords template.
- Template for e-commerce dashboard.
Power BI
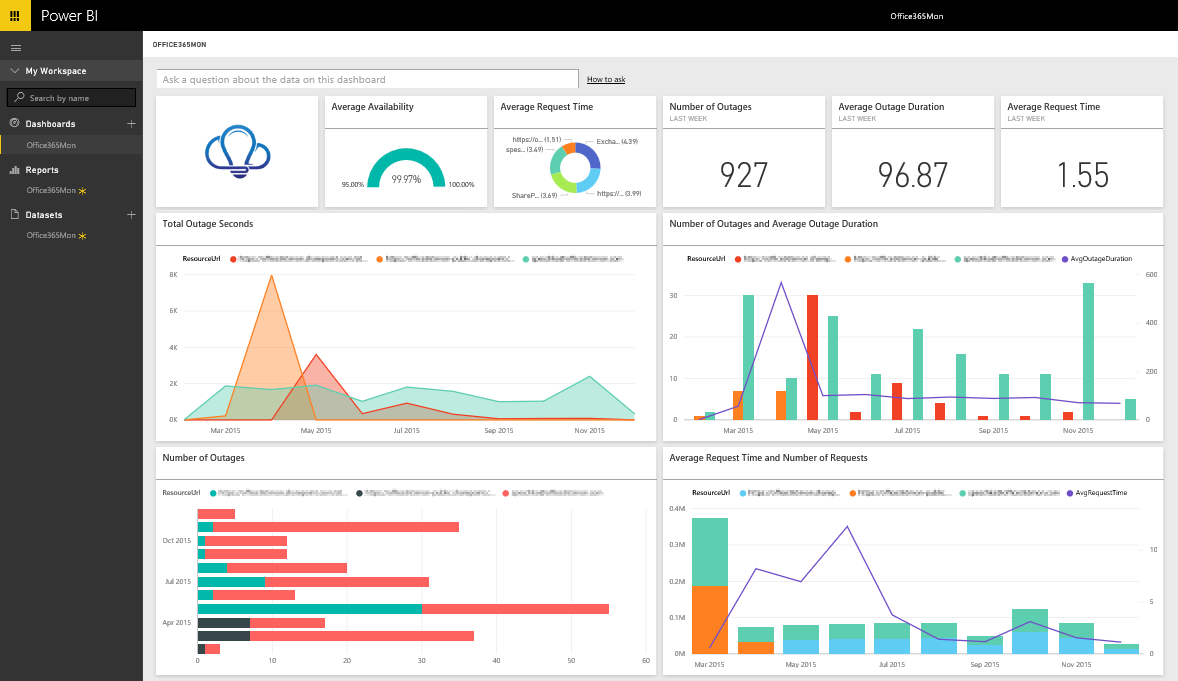
An alternative to Google Data Studio that I absolutely recommend is Power Bi, although it is more business orientated than the former.
It has interesting features such as a large number of connectors, many templates for use and the ability to customize the display of indicators at both the graphic and the mathematical formula level. In fact, it works seamlessly with Microsoft Excel and its Power Query (integrated).
Other business intelligence solutions
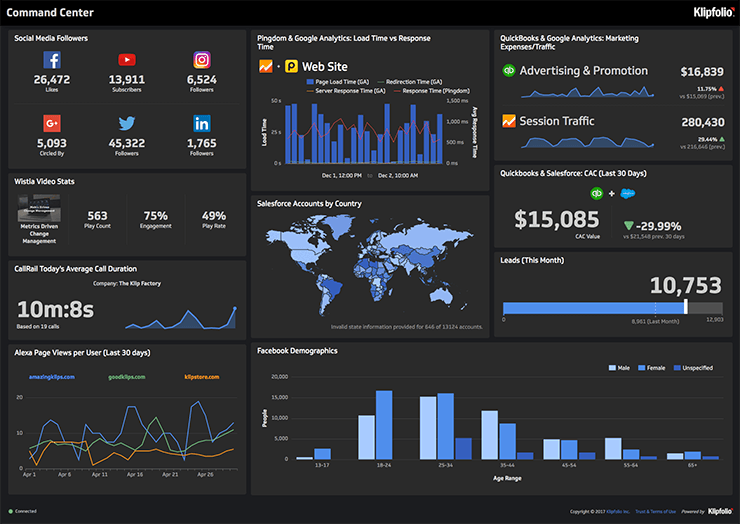
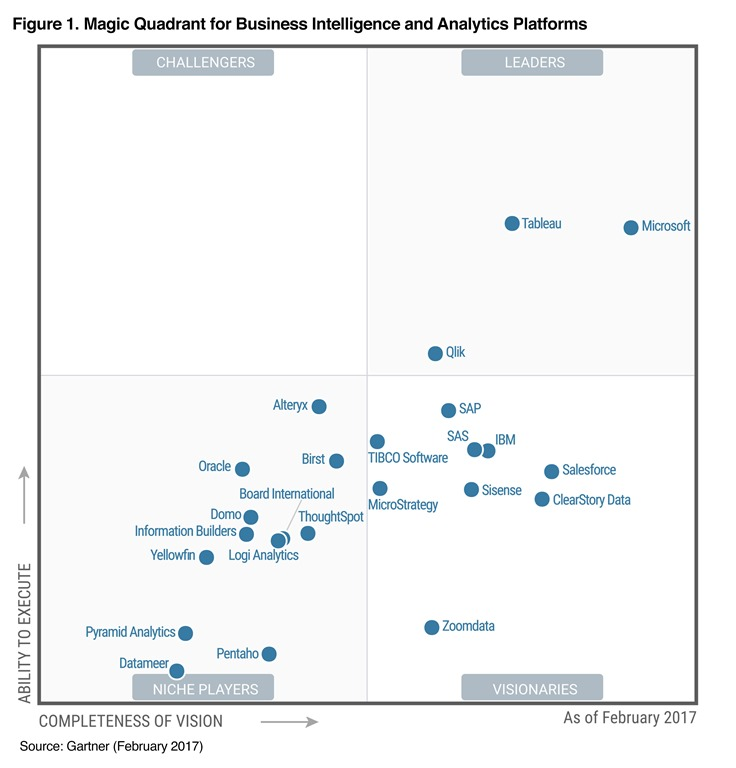
Among the different paid tools, there are some that will help us to have a better view of our business. For example: Klipfolio, Tableau, QliK, Microstrategy and those belonging to IBM, Salesforce, SAP.
Additionally, they have the capacity to be integrated with software that is very important at the business level – although in some instances qualified professionals are required to set them up and deploy them (this is not the case with all tools).
According to the report from the American consultancy firm Gartner, this kind of tool is the most remarkable business intelligence and data display solution.
The purpose of writing this article has been to give a very general summary of the things you need to consider when building a dashboard, either for internal use or to have global view of your business.
Keeping in mind that there are currently many solutions on the market, we need to adapt the chosen tool to our business and ask ourselves what solutions it can provide us while giving us new insights and increasing our profits.
And you, what tools do you use to monitor your business objectives?
Comments are moderated and will only be visible if they add to the discussion in a constructive way. If you disagree with a point, please, be polite.


Tell us what you think.