We help our clients to optimize their investments with analytics. This improves their whole business because, apart from improving their conversion rate, we help them to foster a culture of transparency based on data and experimentation.
The application of analytics to digital applications and the study of the associated data produce two results. The most immediate result allows actions to be triggered in real time so that the client can both improve its sales numbers and meet the needs of its end users and achieve their satisfaction.
The long-term result is weightier: data foster inter-departmental transparency and change the mindset of organizations. Measuring value is no longer the purview of Business Intelligence, Business, Marketing or IT and becomes now everyone’s responsibility.
Analytics is a force for cultural change: every idea, process or project is geared towards measuring those conversion rates that actually make sense for the business.


We combine analytics and software.
Paradigma Digital manages to get analytics conceptualized, designed and implemented by experts from different fields working together throughout the value creation process.
We are unique in that we bring software development professionals and analytics consultants together as part a single Agile team.

Only the goals that matter.
Analytics is most productive when:
- New services are launched.
- There are technological, process-related or organizational changes.
- The competitive pressure increases or the operating margins narrow.
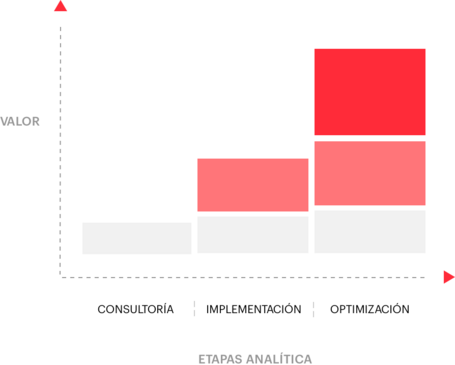
The chain of value of analytics.
We have implemented advanced analytics in websites and/or mobile apps in all the different stages of value creation, from the beginning to post-development optimization.
The value provided by analytics increases from left (minimum) to right (maximum). Every client has asked Paradigma Digital to integrate its consultants at different stages.

5 stages to an analytics project.
5

How do we do it?
An entire analytics project normally has 5 stages depending on the priorities and skill sets involved.
- Phase 1: Current Analytics.
The client and the analytics consultant determine what the business needs: what conversion rates should we measure? What professionals do we have? What data needs are there in current or future Big Data environments? - Phase 2: Specifications.
The consultant and the data analyst write the analytics implementation guide together with the front developer.
- Phase 3: Technical Implementation.
The front developer adds the data layers with all necessary events to the web and/or mobile apps. - Phase 4: Tests & Adjustments.
The front developer and the consultant check to see whether the implementation meets the specifications that were laid down at the beginning. - Phase 5: Production.
The consultant, the data analyst and the client analyze the data and find opportunities for improvement and for A/B testing and new conversion rates to be measured.
Integration in different stages
Examples
+30% increase in the sales of a product.
A leading supermarket chain in Spain launched a new version of its eCommerce site in 2017. Paradigma conducted a three-pronged analysis of both the chain itself and its competitors to improve the site’s conversion rates.
The consultancy side of things consisted in suggesting precise actions to be taken on an immediate basis in four areas – competitive landscape, user experience, front-end performance, and A/B testing – to improve conversion rates.
We analyzed the suitability of performing A/B tests to test the recommendations stemming from the analyses of the Services, the UX and the Interface. A requirement imposed on the tests was that they had to be aligned with SEO, digital marketing and front-end performance.
One of the tests yielded preliminary results of an improvement of up to 33% in the sales of a product line. Thanks to these tests, the complex process of collecting data and monitoring the evolution of this chain’s eCommerce was made transparent.
+600% increase in goal fulfilment
We designed the new portal for the biggest provider of credit cards for consumer financing. The website had a public area and a private area to provide new services to its customers, including the financing of department store purchases and the management of lines of credit.
One of the biggest challenges facing the launch was how to get customers to sign a new service contract. We also revamped the site’s login process and updated its multichannel access (web, phone and in-store).
We designed the application’s analytics to detect inefficiencies in the contract renewal processes. We wrote a Google Tag Manager integration guide, which had more than 60 events in as many data layers, and set up Analytics for measuring half a dozen business goals that are measured via KPI ratios.
Today this client has advanced analytics that allows it to optimize its in-house processes for its customers in Spain and the hundreds of thousands of visitors to its site. Target conversions were up by 672.6 per cent over comparable periods in 2018 and 2017.
Validation with CRM.
A leading pizza delivery company – which has a very prominent market position in Spain – launched a new website with eCommerce conversion rate measurement capabilities integrated in Google Analytics. This chain manages hundreds of thousands of orders each month through its website, and all the data is stored in Google Analytics.
The diagnoses resulting from implementing Google Analytics allowed the client to merge its CRM data with its web analytics data. Thanks to Paradigma, web analytics gives analysts real-time access to reliable data on both overall sales and the performance of specific campaigns and of promotions.

Cost savings.
A personal credit provider manages tens of thousands of users of several of its mobile apps.
The firm asked Paradigma Digital for help within the framework of a project for developing native mobile applications for iOS and Android. After studying a case of implementation in Adobe Analytics, our consultants applied a very pragmatic, business-orientated solution to the apps.
They also performed several user tests to check the efficiency of use of and the users’ satisfaction with the product before it was launched.
Several user tests were carried out on the apps and the website as part of the project. Apart from a series of recommendations, a serious incident was detected in the contracting flow that was affecting 80% of the users and that would have cost the client thousands of euros.
+10% increase in the conversion rates.
Our client – a mobile operator – is a Mobile Virtual Network Operator (MVNO) in several countries: Spain, Argentina, Ecuador, Peru, and Guatemala. This MVNO only competes in the digital channel, so it is essential for it to optimize its conversion rates.
We implemented web analytics with event data layers in Google Tag Manager. We conducted A/B tests in each country where the mobile operator operates to optimize its eCommerce checkout pages.
A/B testing allowed the design and commercial claims of each page to be fine-tuned. The management teams of each of the client’s operating businesses had a first impression of the methodology and the potential of A/B testing and CRO.
An A/B test resulted in an 11% to 14% improvement in the conversion rate of a landing page at the start of the checkout process.

